Interactive Map Workshop
| Date |
Date
|
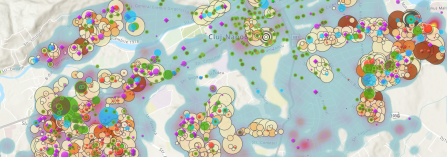
The project team met online in a small workshop group with stakeholders and data providers to present the interactive energy poverty map of the Cluj-Napoca metropolitan area. This was the first chance for the stakeholders to see the first concrete project outcome.
The meeting kicked off with a brief introduction to the project by George Jiglau of the UBB and Jakob Hoffmann of adelphi. In attendance were over 10 stakeholders from the municipality and the regional utility companies, who shared their data with our project and made the creation of the map possible in the first place.
Titus Man of the UBB demonstrated the use of the map to the attendees. The attendees could see the number of social households, the number of renovated homes, which areas receive social aid for energy, as well as consumption metrics for buildings. It was very important for the attendees to see how the data, which they had in large part provided, is being put to use. Importantly, the quantitative aspects currently captured by the map do not paint the full picture of energy poverty. To complement the data, George Jiglau of the UBB presented the household survey, which is being carried out, and focuses on people’s perception of climate change, trust in neighbours, the importance of heating costs, the tenant-owner relationship, and their relationship with energy suppliers, amongst other indicators. Mr. Jiglau was able to speak about some promising preliminary qualitative results, which give interesting insights into behavioural aspects of consumers and will complete the identification of energy poor households and clusters.
The last part of the project involved a positive exchange between the stakeholders and project team, with both sides looking forward to continued collaboration in terms of data sharing. Furthermore, there was discussion about replicating this model for other cities, particularly ones where the topic of energy poverty may be more acute. The finalised version of the map with all three levels of data; quantitative, survey, and consumption, is expected early next year.

